File:BC3.PNG: Difference between revisions
Jump to navigation
Jump to search

Marcocarloni (talk | contribs) Marcocarloni uploaded a new version of "File:BC3.PNG": Reverted to version as of 12:50, 16 September 2016 |
Marcocarloni (talk | contribs) Marcocarloni uploaded a new version of "File:BC3.PNG": Reverted to version as of 12:52, 16 September 2016 |
(No difference)
| |


Latest revision as of 12:53, 16 September 2016
File history
Click on a date/time to view the file as it appeared at that time.
| Date/Time | Thumbnail | Dimensions | User | Comment | |
|---|---|---|---|---|---|
| current | 12:53, 16 September 2016 | 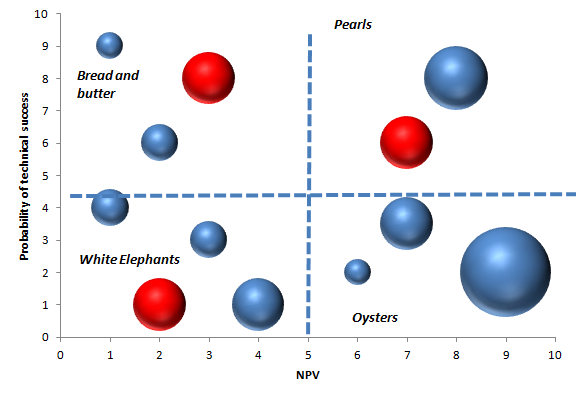 | 576 × 399 (77 KB) | Marcocarloni (talk | contribs) | Reverted to version as of 12:52, 16 September 2016 |
| 12:52, 16 September 2016 | 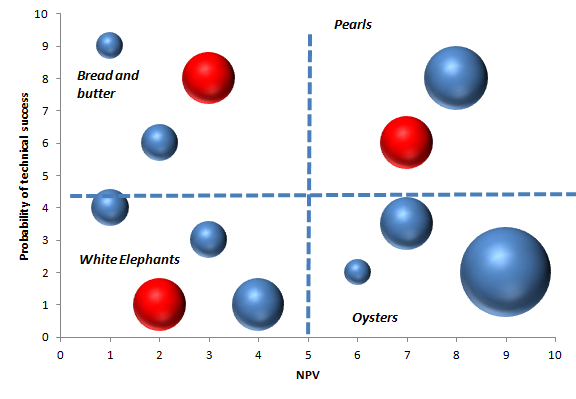 | 576 × 399 (77 KB) | Marcocarloni (talk | contribs) | Reverted to version as of 12:50, 16 September 2016 | |
| 12:52, 16 September 2016 | 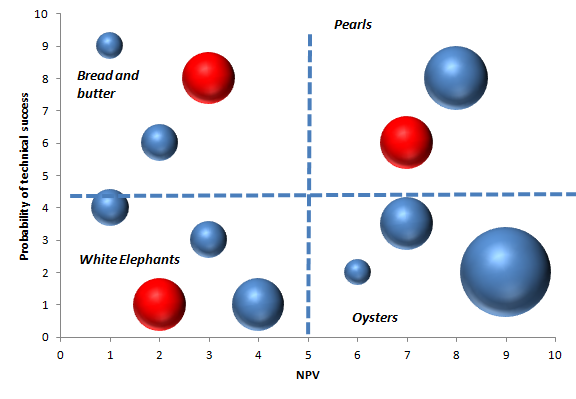 | 576 × 399 (77 KB) | Marcocarloni (talk | contribs) | A Bubble Chart, on the x-axis is shown NPV and on the y-axis is shown the probability of success. This means that pearls are always preferred and the white elephants always want to be avoided . | |
| 12:50, 16 September 2016 | 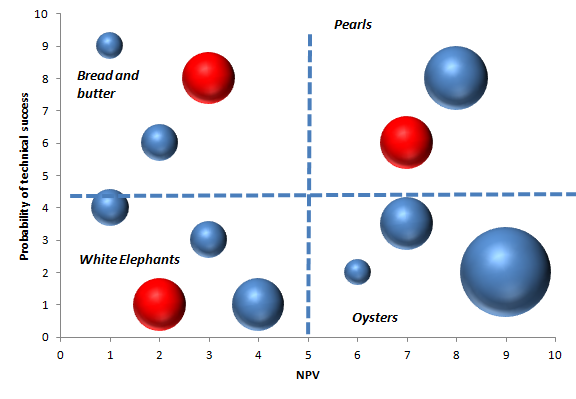 | 576 × 399 (77 KB) | Marcocarloni (talk | contribs) |
You cannot overwrite this file.
File usage
The following 2 pages use this file:
